First Things First
Since we’re trying to be good developers we’re going to think about performance, Mobile First. Many who have grown accustomed to this term usually refer to it as tackling responsive aspects of the site first. Though this idea isn’t fallacious, it’s not complete either. There is more to making a mobile site than setting a few media queries and getting it to look nice.
We should consider Networking, CPU, and GPU on mobile devices.
As discussed in part 2 you should do your own research and find what devices you’re targeting. In an ideal world you would test these target devices by physically plugging them into your laptop, pulling up dev tools, and profiling your application. Since many of us don’t have a quiver full of deprecated mobile devices, Chrome Dev Tools offers a built in Network and CPU Throttling setting to help us emulate slower devices and make performance improvements. If you need a definitive performance audit you should test with real devices on real networks when possible.
See Progressive Performance (Chrome Dev Summit 2016) for some great insight on why testing on mobile is important.
Throttling - Timeline Tab
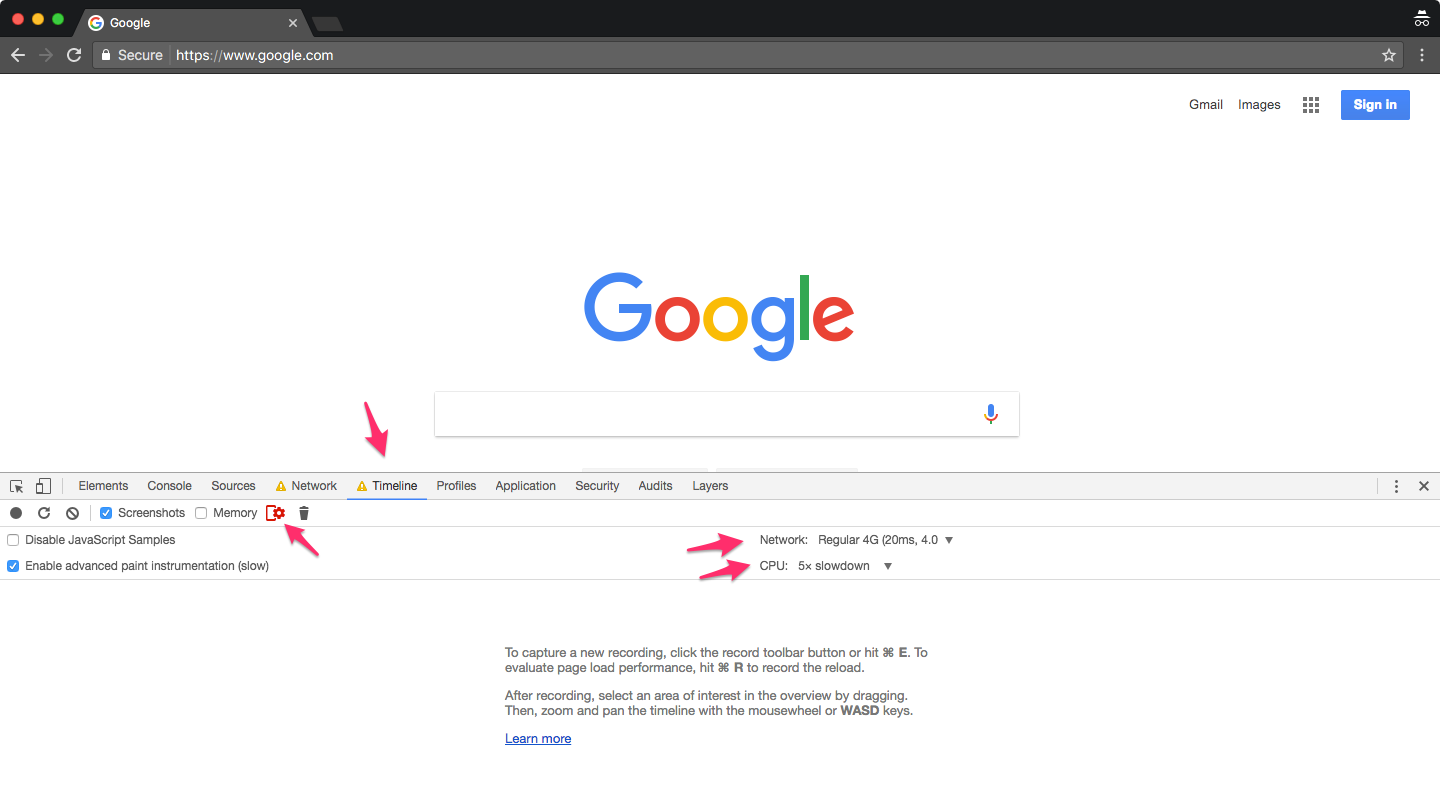
In Chrome you can easily turn on throttling by doing the following:
Open Chrome Dev Tools (opt+cmd+j on Mac)
Select Timeline
Select the mobile device + cog wheel icon
Choose a Network and CPU that best reflect your target device
Now when profiling your site, Chrome will do it’s best to emulate these throttle settings.
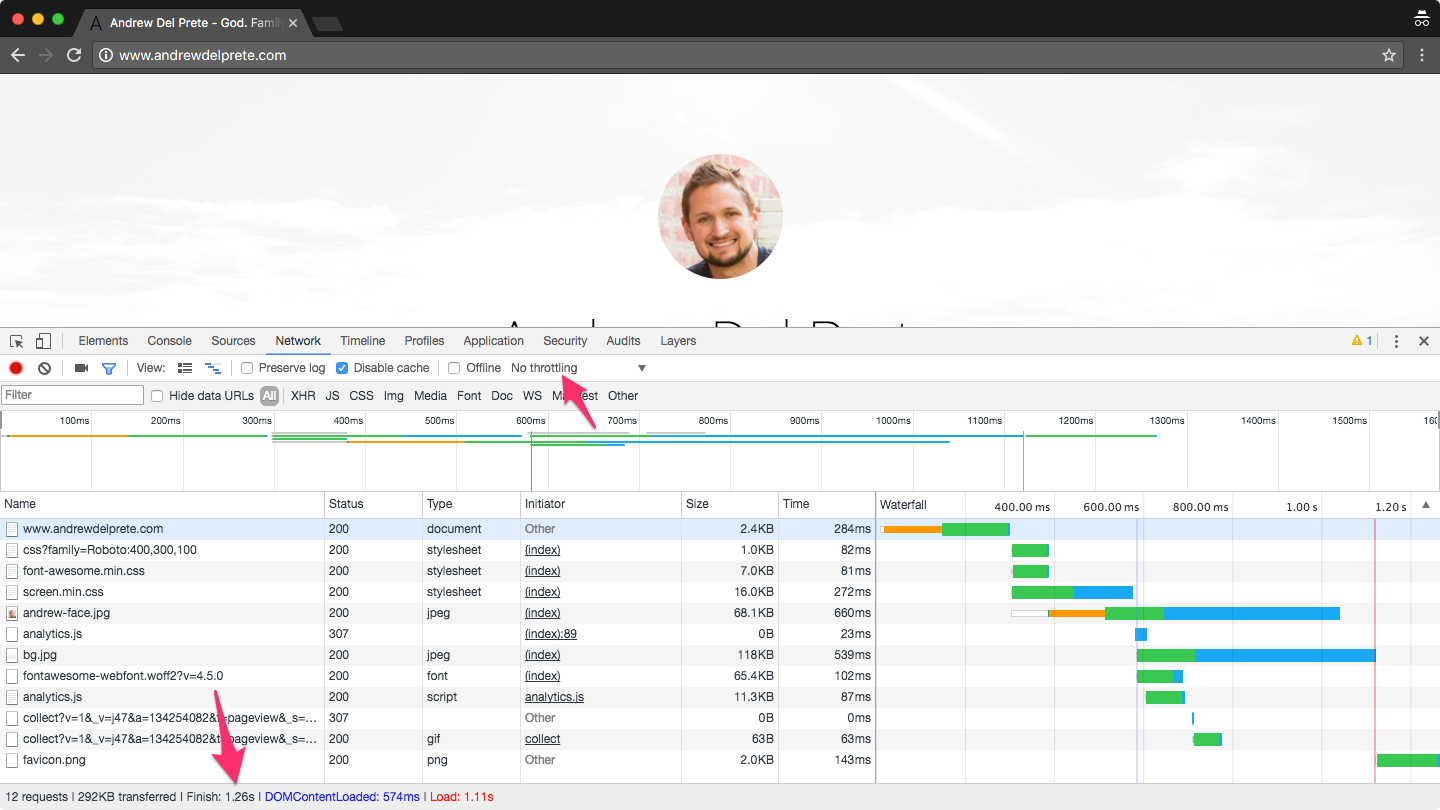
Throttling - Network Tab
Chrome Dev Tools also offers a way to throttle the Network under the Network Tab.
No Network Throttling - 1.26s to download resources
Yes Network Throttling - 2.68s to download resources
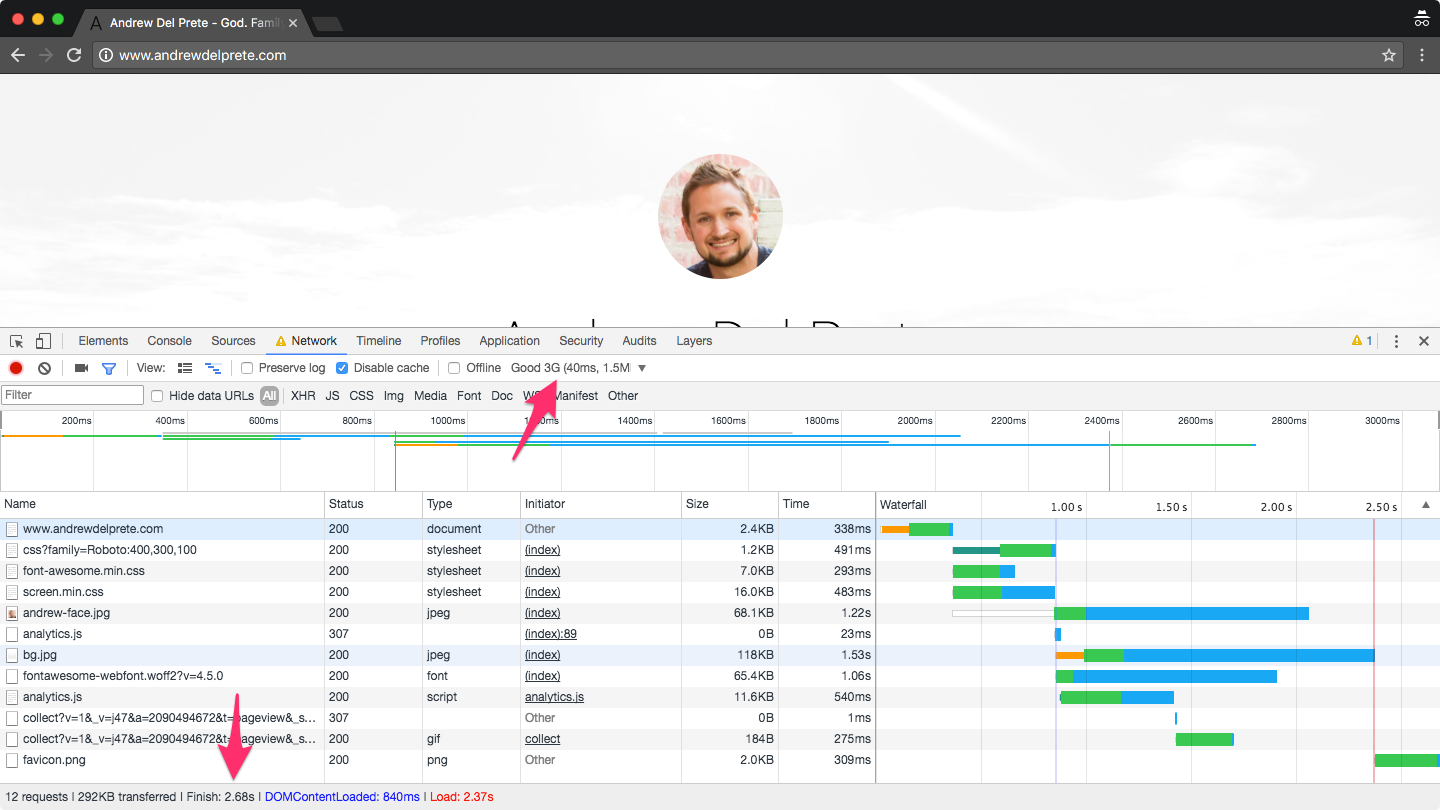
*Note - I’m using Chrome Canary for the latest Chrome Dev tools
Ain’t nothing like the real thing
Depending on your target device and it’s presumed internet speed, you have several options of profiling your application’s performance:
Android - Devices running Android are the easiest to start testing because they naturually work well with Chrome Dev Tools. See Get Started with Remote Debugging Android Devices.
iOS - Unfortunelty iOS isn’t compatible with Chrome Dev Tools but Safari has it’s own set tools called Web Inspector. See Web Development Tools.
You can also use tools like BrowserStack or GhostLab to profile a range of desktop and mobile devices over the web.
Should I bother?
You’re probably saying to yourself “testing on mobile sounds like work. Are we expected to spend extra time throtting our CPU / Connection or even purchase older devices?”
I think it depends on a couple of factors:
- Who and what are you targeting?
- Does your team have the resources?
- Does your team have the time?
- Do you care about your users? (Just kidding… kind of.)
- Is throttling sufficient enough for your needs?
In my opinion, the best thing developers can do is learn the basics and make a conscious effort toward improving performance during development.
In my next post we’ll look at the Network Tab in more detail; specifically what TTFB (Time to First Byte) means and how to measure it.
Thanks for reading,
-Andrew Del Prete